Customizing Chart Views with QML

Note: This is part of the Charts with QML Gallery example.
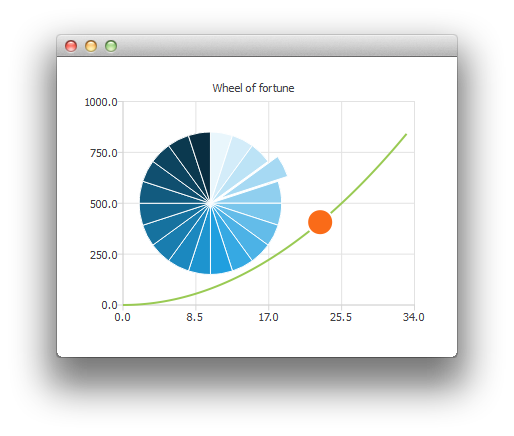
Here we show you how to create a wheel of fortune by customizing a pie series.
First we create the ChartView and a couple of series.
 ChartView {
     id: chartView
     anchors.fill: parent
     title: "Wheel of Fortune"
     legend.visible: false
     antialiasing: true

     PieSeries {
         id: wheelOfFortune
         horizontalPosition: 0.3
     }

     SplineSeries {
         id: splineSeries
     }

     ScatterSeries {
         id: scatterSeries
     }
 }
The application data is generated in Component.onCompleted of the main rectangle:
 Component.onCompleted: {
     __intervalCoefficient = Math.random() + 0.25;

     for (var i = 0; i < 20; i++)
         wheelOfFortune.append("", 1);

     var interval = 1;
     for (var j = 0; interval < 800; j++) {
         interval = __intervalCoefficient * j * j;
         splineSeries.append(j, interval);
     }
     chartView.axisX(scatterSeries).max = j;
     chartView.axisY(scatterSeries).max = 1000;
 }
The following customizations are done repeatedly with a timer. To highlight one of the pie slices at time we modify its exploded property:
 wheelOfFortune.at(index).exploded = false;
 root.__activeIndex++;
 index = root.__activeIndex % wheelOfFortune.count;
 wheelOfFortune.at(index).exploded = true;
Then an animation using a scatter series with one data point:
 scatterSeries.clear();
 scatterSeries.append(root.__activeIndex, interval);
 scatterSeries.color = Qt.tint(scatterSeries.color, "#05FF0000");
 scatterSeries.markerSize += 0.5;
When the wheel of fortune has stopped, we make the active slice blink by modifying its colors.
 // Switch the colors of the slice and the border
 wheelOfFortune.at(index).borderWidth = 2;
 switchColor = wheelOfFortune.at(index).borderColor;
 wheelOfFortune.at(index).borderColor = wheelOfFortune.at(index).color;
 wheelOfFortune.at(index).color = switchColor;